Introduction about Robert Hooke.
Robert Hooke (shown in the picture below), who is well known for creating the “Hooke’s Law”, was born in 1635 in Freshwater on England’s Isle of Wight. As a child he was a quick learner who was interested in many fields e.g. painting and mechanical sciences etc. He was educated at Oxford and spent his most of the life working for Royal Society and as a professor in Gresham College. During his life he was most interested in astrono my, physics and biology. His most important publication was a book called “Micrographia” where he documented his experiments made with microscope. In 1678 he made public his groundbreaking theory in publication “Hooke’s Lectures of Spring” where he shared his theory of elasticity, which is now known as Hooke’s Law. He stated that the force required to extend or compress a spring is proportional to the distance of that extension or compression (more about Hooke’s law in the next section). Robert Hooke died at the age of 67 in 1703. [2]
Hooke’s Law.
It is worth pointing out that Hooke’s law only applies, if the force applied to the object does not does not break it, for example, a force which is applied to spring is too high that in the result spring will go past its elastic region, it will deform and never go back to its previous state. [3] Hooke’s Law states that the extension of an elastic object is directly proportional to the force applied to it:
F = kx
F – force applied in newtons, (N).
k – the spring constant in newtons per meters, (N/m).
x – extension in meters, (m).
If the spring constant is higher, then that means that the material is stiffer. [4] In an exercise where force and extension is given, and object has not gone past its elastic region, it would be easy to calculate springs constant (shown in picture below, to the left), but in a scenario where force is deforming the spring, it would be more appropriate to calculate the value of k by choosing different force applied and extension periods (shown in the picture below, to the right).


From both graphs we can conclude that in the second graph Hooke’s law is no longer acting, as k1 and k2 values are not equal. It is possible to watch more about elasticity and Hooke’s Law in the video below where professors from MIT is explaining everything in more details.
Lectures by Walter Lewin. (2015). 8.01x – Lect 10 – Hooke’s Law, Springs, Pendulums, Simple Harmonic Motion. [Online Video]. 7 February 2015. Available from: https://www.youtube.com/watch?v=tNpuTx7UQbw. [Accessed: 20 November 2016
Description of the experiment.
An experiment was carried out where extension was measured of three di fferent materials. Materials were put under the stress of different weights, lightest was 1 newton and heaviest was 9 newtons. Every weight stretched material differently, so the results were recorded in the table. To simplify deformation of materials were named y1, y2 and z. In the picture to the right, it is possible to see the schematics of the experiment. In the schematic it is illustrated how a force (F) is putting the material under the stress, so the material extends by x millimetres. It possible to calculate weight with the formula:
W = mg
where m is mass and g is gravitational pull.
Results of the experiment.
After putting materials through different stress a table of data was made which represents data which was collected when experiment about Hooke’s Law was conducted. First column represents the weight which put the material under the stress, second, third and fourth column represents the extensions in materials after a specific force was applied to the material. To make analysis of the data it would be better to compare materials using graphs.

The blue point represents how applied force changes deformation of material y1, orange –y2.
The value of y1 was calculated using formula:
y1 = ax + b
where a is the gradient of the line, which is also equal to spring constant, k, and b is intercept of the vertical axis, x is force applied. By using Excel options, we can get the exact values of gradient and the vertical intercept. In this case the value of a is 1.5583 and b is 1.375.
The value of y2 was calculated using formula:
y2 = (a + 0.5)x + c
where a is remains gradient of the lane and x is applied force, only in this case c is intercept with vertical axis. In this case the value of a is 2.0583, but c is 0.2.
The behaviour of both materials clearly shows that both materials do not go past their elastic region also when comparing gradient of the lane it is ob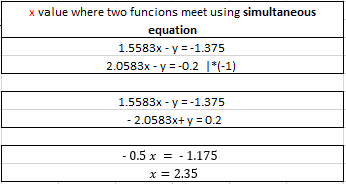 vious that the 2nd material is a little bit stiffer than 1st material. At one-point material 1 and 2 needs the same force to reach the same deformation, using simultaneous equations it is possible to calculate what
kind of force was applied to reach the same deformation for both materials (see table 2). Calculations show that when the force applied is equal to 2.35 newtons then the deformation will be the same for both materials.

The third materials appear to reach its elastic limit, that is why it is easy to predict that after force will not be applied anymore, material will deform and it will never reach its original state again. From the graph it is possible to say that the material goes beyond its elastic region after more than 3N force is applied to it.
Possible errors.
Even though it looks like the results of experiment are correct, it is possible that some errors where made while experiment was done or even when calculations were made. These errors may occur because of following reasons:
- Accuracy of device while measuring the deformation.
- Human error.
- Accuracy of the weights.
- Calculation error.
A slight error was noticed for the 1st material while applying force of 7 newtons. This error might have happened because of human error (reading the results bad or poor design of the experiment). But overall it seems that not a lot of errors could have happened while conducting the experiment.
Conclusion.
After experiment was conducted a few conclusions can be made:
- From the 1st graph, while calculating the value of springs constant it possible to say that 2nd material is a bit stiffer than the 1st.
- For the 1st and the 2nd material there is one point where both materials reach the same deformation while exactly the same force is being applied in this case it was 2.35 newtons.
- In the 2nd graph it is stated that the material goes beyond its elastic region that is why Hooke’s Law is no longer acting on it, and when the force Is nor more applied the material will not go back to its previous state.
References.
[2] – Biography. com Editors (2015) Robert Hooke Biography. Available at: http://www.biography.com/people/robert-hooke-9343172 (Accessed: 20 November 2016).
[4] – BBC (2006) GCSE Bitesize: Hooke’s law. Available at: http://www.bbc.co.uk/schools/gcsebitesize/science/add_aqa/forces/forceselasticityrev2.shtml (Accessed: 20 November 2016).
